Travel time estimates
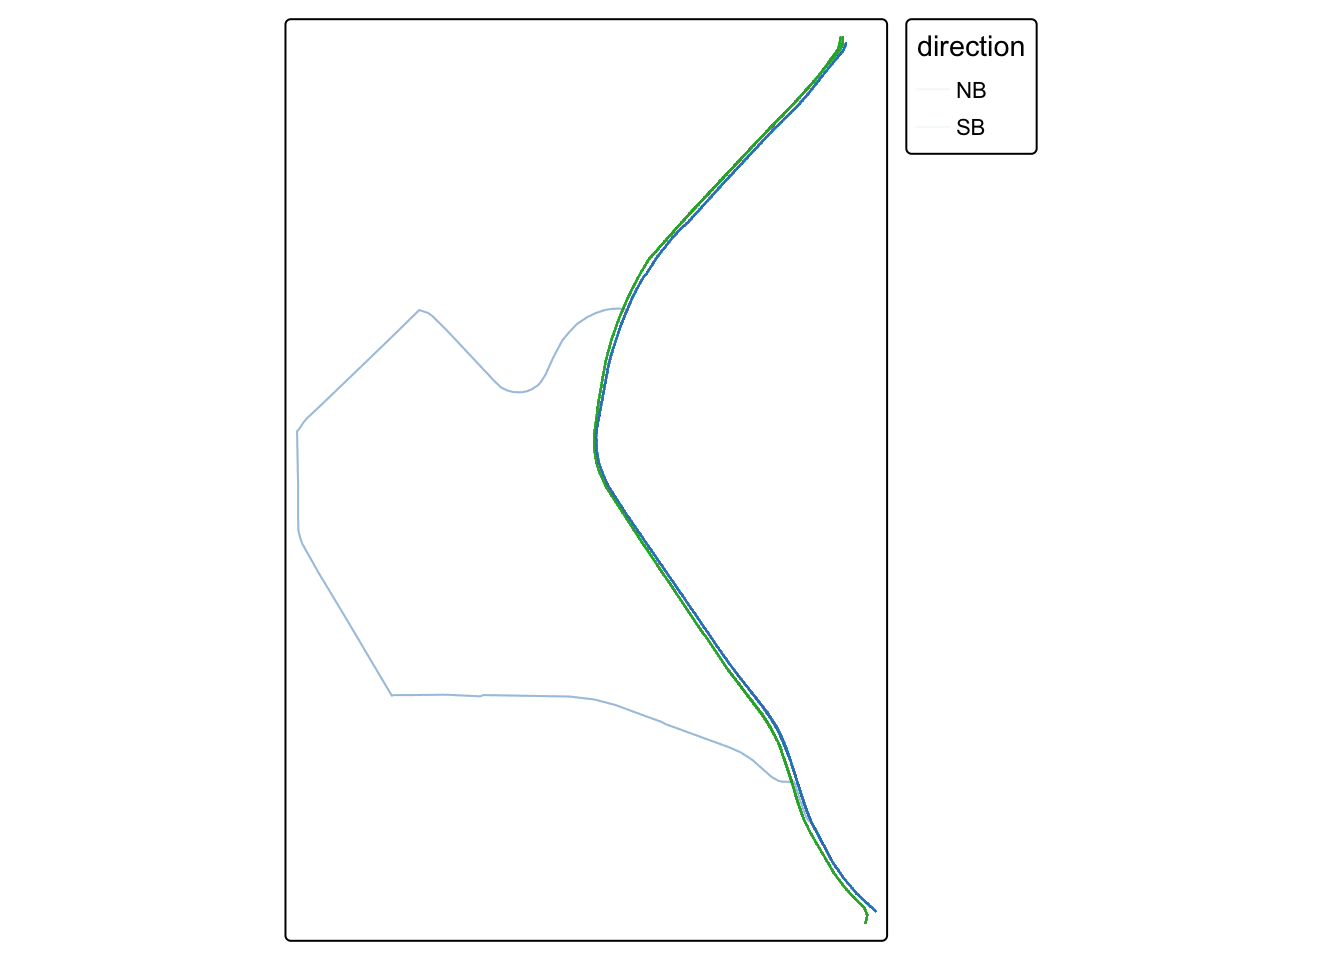
John Nolen Drive
Travel time estimates for the John Nolen Drive corridor between Rimrock and the “Hairball” (JND/Wilson/Willy/Blair). Note that for this route, the shortest duration route is shown even when that involves not taking JND itself but an alternative route.
Travel time estimates
Travel time estimates in a sortable and filterable table:
Overall
Summary statistics
| Estimated travel times (minutes) | |||||
| Direction | Mean | Median | Minimum | Maximum | 90% of trips |
|---|---|---|---|---|---|
| NB | 5.9 | 5.2 | 3.9 | 18.4 | 4.2-10.3 |
| SB | 6.2 | 5.4 | 3.9 | 18.2 | 4.7-10.1 |
| Estimated travel times (minutes) | |||||
| Direction | Mean | Median | Minimum | Maximum | 90% of trips |
|---|---|---|---|---|---|
| NB | 5.6 | 5.3 | 4.2 | 10.6 | 4.4-8.2 |
| SB | 5.9 | 5.4 | 5.0 | 7.7 | 5-7.4 |
| Estimated travel times (minutes) | |||||
| Direction | Mean | Median | Minimum | Maximum | 90% of trips |
|---|---|---|---|---|---|
| NB | 5.3 | 5.0 | 4.2 | 12.1 | 4.5-7.1 |
| SB | 5.4 | 5.1 | 4.5 | 7.7 | 4.7-6.6 |
| Estimated travel times (minutes) | |||||
| Direction | Mean | Median | Minimum | Maximum | 90% of trips |
|---|---|---|---|---|---|
| NB | 5.4 | 5.0 | 4.2 | 14.1 | 4.5-8.3 |
| SB | 5.4 | 5.2 | 4.5 | 10.1 | 4.8-6.9 |
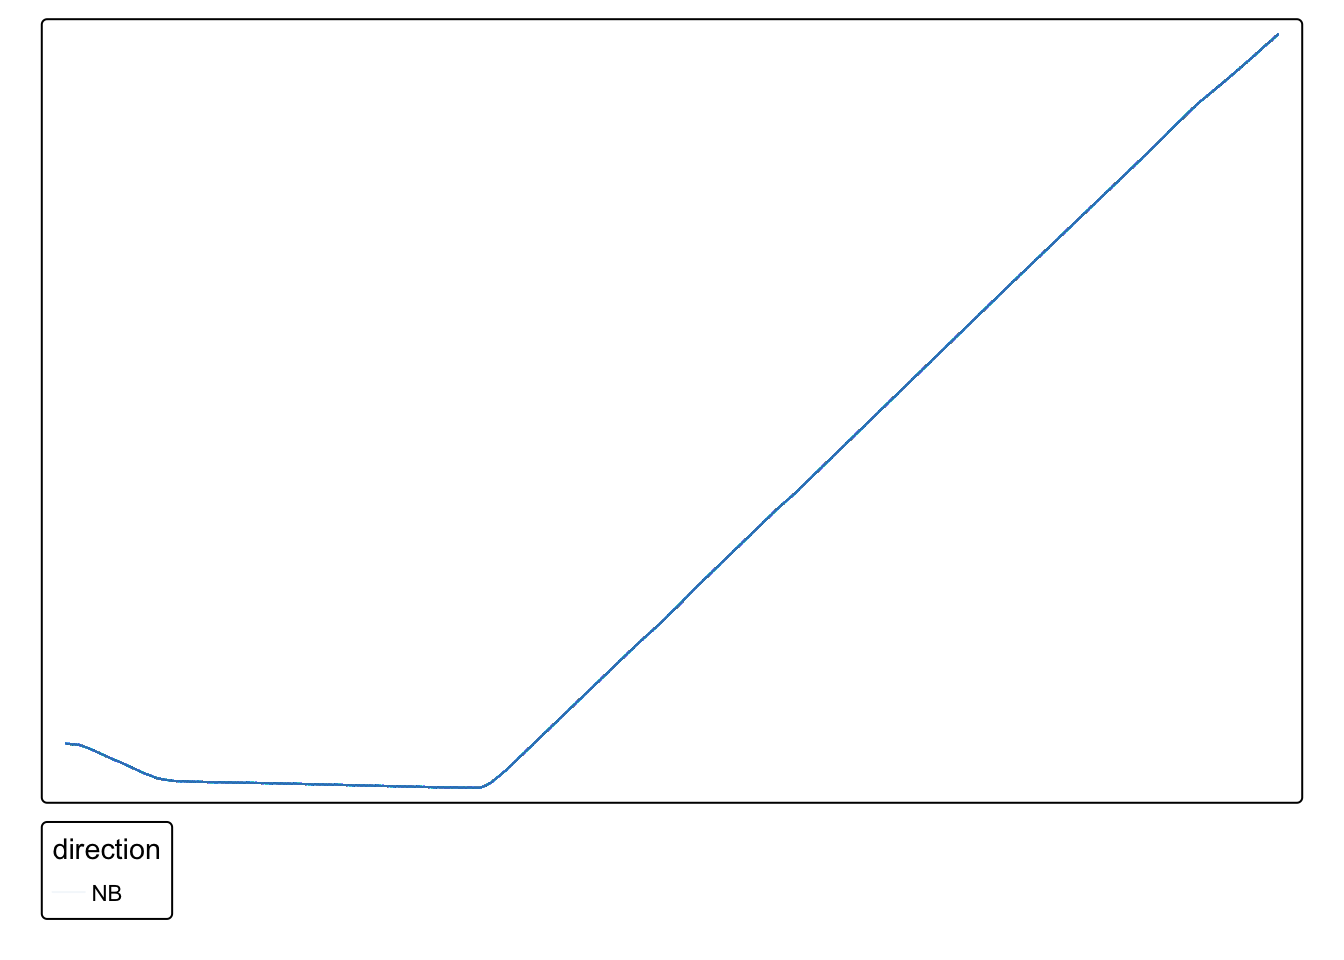
Travel time plots
This plot shows the median travel time (middle line), the 25th and 75th percentile (interquartile range; box), 1.5 times the interquartile range (whiskers).
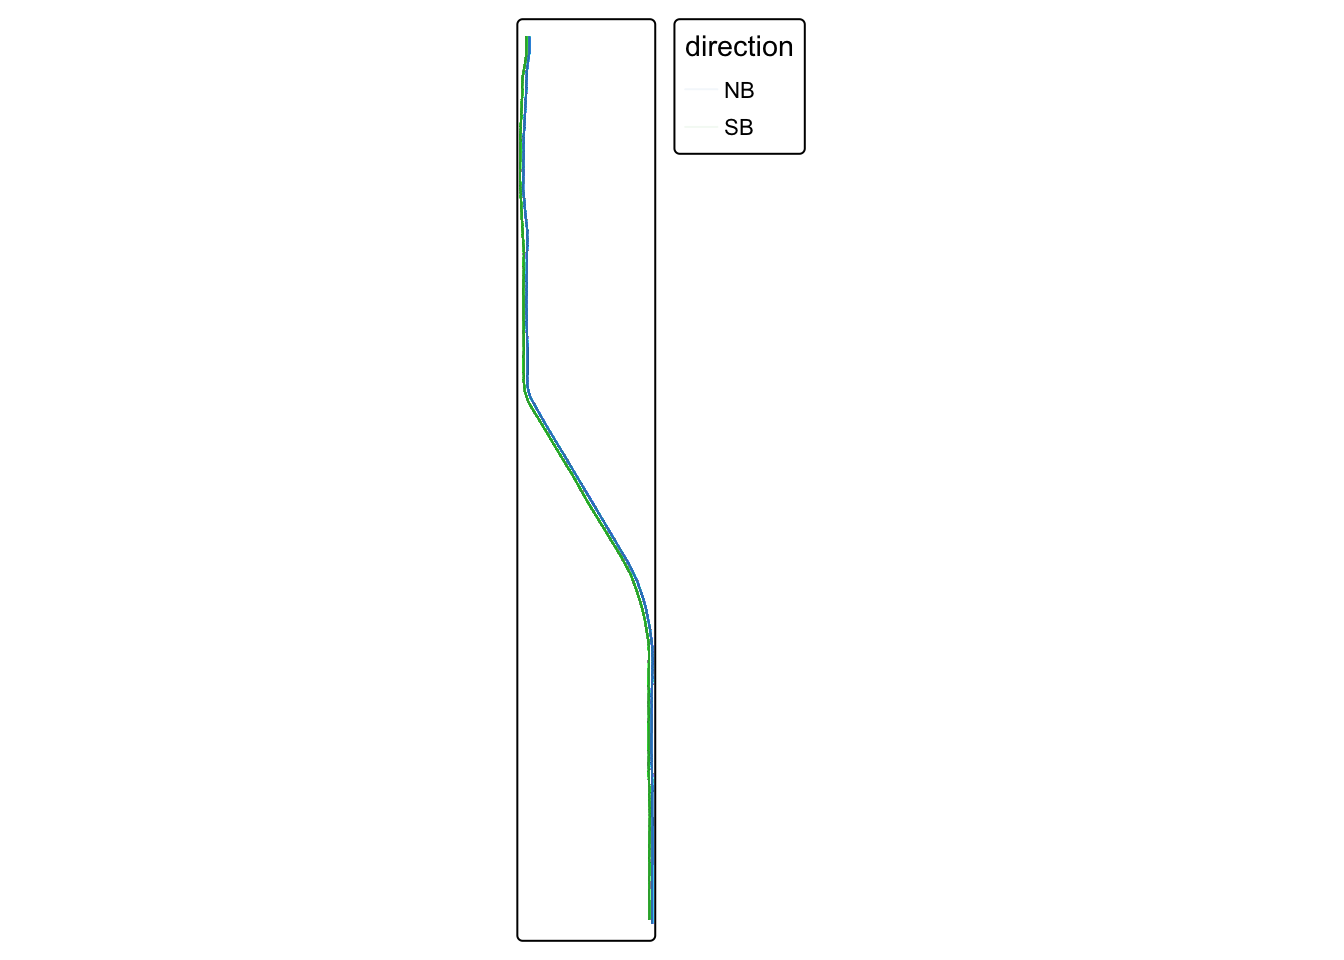
Park Street
Travel time estimates for the Park Street corridor between Badger Road and University Ave.
Travel time estimates
Travel time estimates in a sortable and filterable table:
Overall
Summary statistics
| Estimated travel times (minutes) | |||||
| Direction | Mean | Median | Minimum | Maximum | 90% of trips |
|---|---|---|---|---|---|
| NB | 8.7 | 8.4 | 6.0 | 23.6 | 7-11.6 |
| SB | 8.3 | 8.0 | 5.8 | 18.7 | 7-10.8 |
| Estimated travel times (minutes) | |||||
| Direction | Mean | Median | Minimum | Maximum | 90% of trips |
|---|---|---|---|---|---|
| NB | 8.4 | 8.6 | 6.6 | 9.2 | 7.1-9 |
| SB | 8.5 | 8.6 | 6.6 | 9.4 | 7.4-9.2 |
| Estimated travel times (minutes) | |||||
| Direction | Mean | Median | Minimum | Maximum | 90% of trips |
|---|---|---|---|---|---|
| NB | 8.3 | 8.5 | 6.6 | 10.4 | 7.2-9.1 |
| SB | 8.4 | 8.6 | 6.4 | 9.7 | 7.3-9.2 |
| Estimated travel times (minutes) | |||||
| Direction | Mean | Median | Minimum | Maximum | 90% of trips |
|---|---|---|---|---|---|
| NB | 8.6 | 8.5 | 6.6 | 16.1 | 7.3-10.1 |
| SB | 8.6 | 8.6 | 6.4 | 18.2 | 7.3-9.5 |
Travel time plots
This plot shows the median travel time (middle line), the 25th and 75th percentile (interquartile range; box), 1.5 times the interquartile range (whiskers).
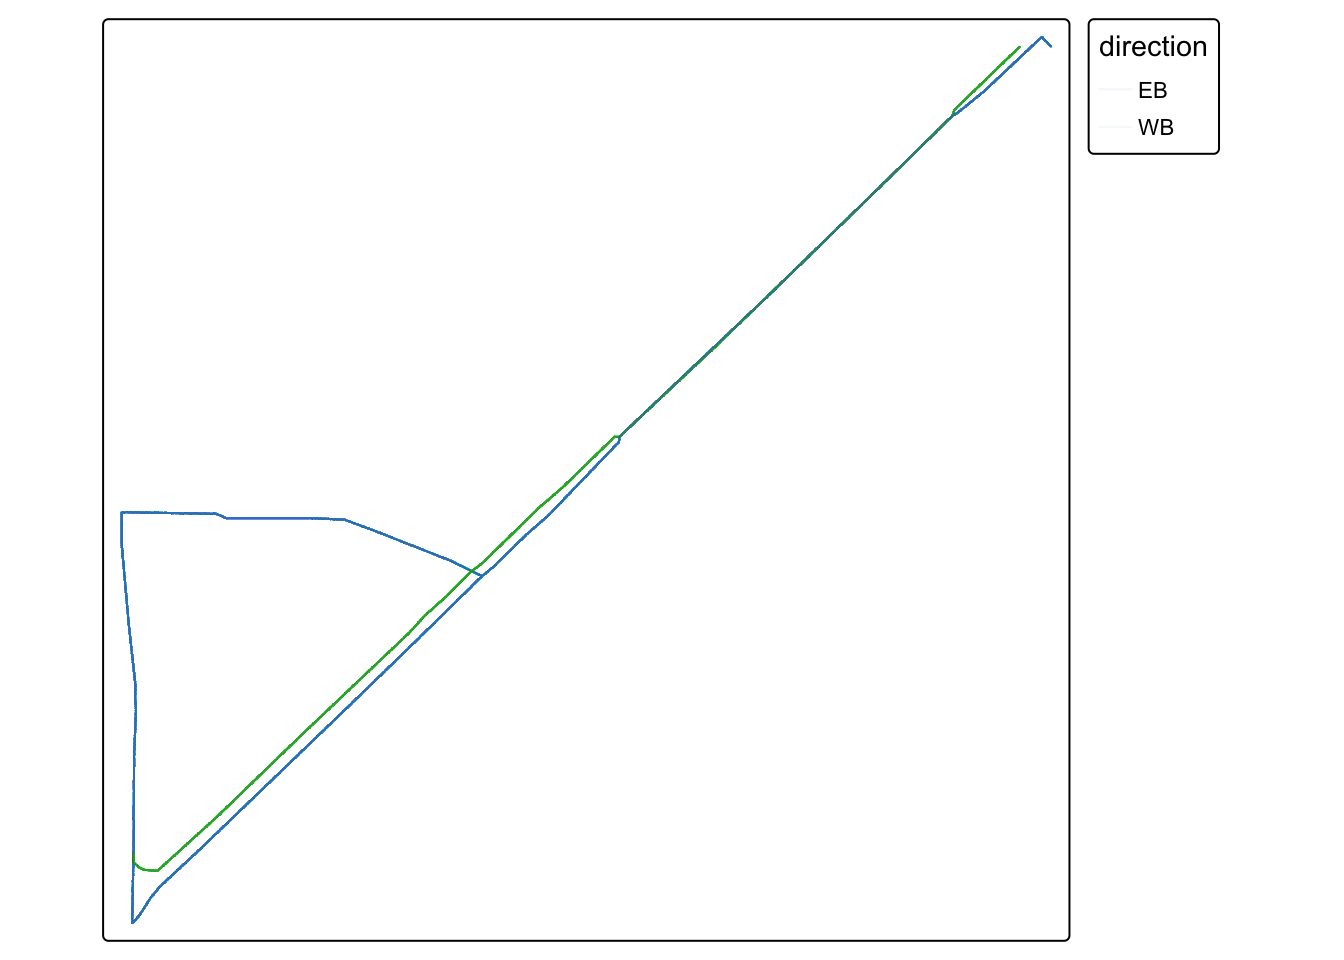
West Washington Avenue
Travel time estimates for the West Washington Ave corridor between Park and Fairchild.
Travel time estimates
Travel time estimates in a sortable and filterable table:
Overall
Summary statistics
| Estimated travel times (minutes) | |||||
| Direction | Mean | Median | Minimum | Maximum | 90% of trips |
|---|---|---|---|---|---|
| EB | 4.2 | 3.9 | 2.9 | 12.3 | 3.1-6.6 |
| WB | 4.2 | 3.9 | 2.8 | 13.9 | 3.3-6.6 |
| Estimated travel times (minutes) | |||||
| Direction | Mean | Median | Minimum | Maximum | 90% of trips |
|---|---|---|---|---|---|
| EB | 3.9 | 3.9 | 3.2 | 4.6 | 3.3-4.4 |
| WB | 3.8 | 3.9 | 3.1 | 4.4 | 3.4-4.2 |
| Estimated travel times (minutes) | |||||
| Direction | Mean | Median | Minimum | Maximum | 90% of trips |
|---|---|---|---|---|---|
| EB | 4.1 | 3.9 | 3.0 | 6.8 | 3.2-5.8 |
| WB | 3.8 | 3.8 | 3.1 | 4.7 | 3.4-4.3 |
| Estimated travel times (minutes) | |||||
| Direction | Mean | Median | Minimum | Maximum | 90% of trips |
|---|---|---|---|---|---|
| EB | 4.3 | 4.0 | 3.0 | 8.5 | 3.3-6.6 |
| WB | 4.1 | 3.9 | 3.1 | 13.9 | 3.4-5.3 |
Travel time plots
This plot shows the median travel time (middle line), the 25th and 75th percentile (interquartile range; box), 1.5 times the interquartile range (whiskers).
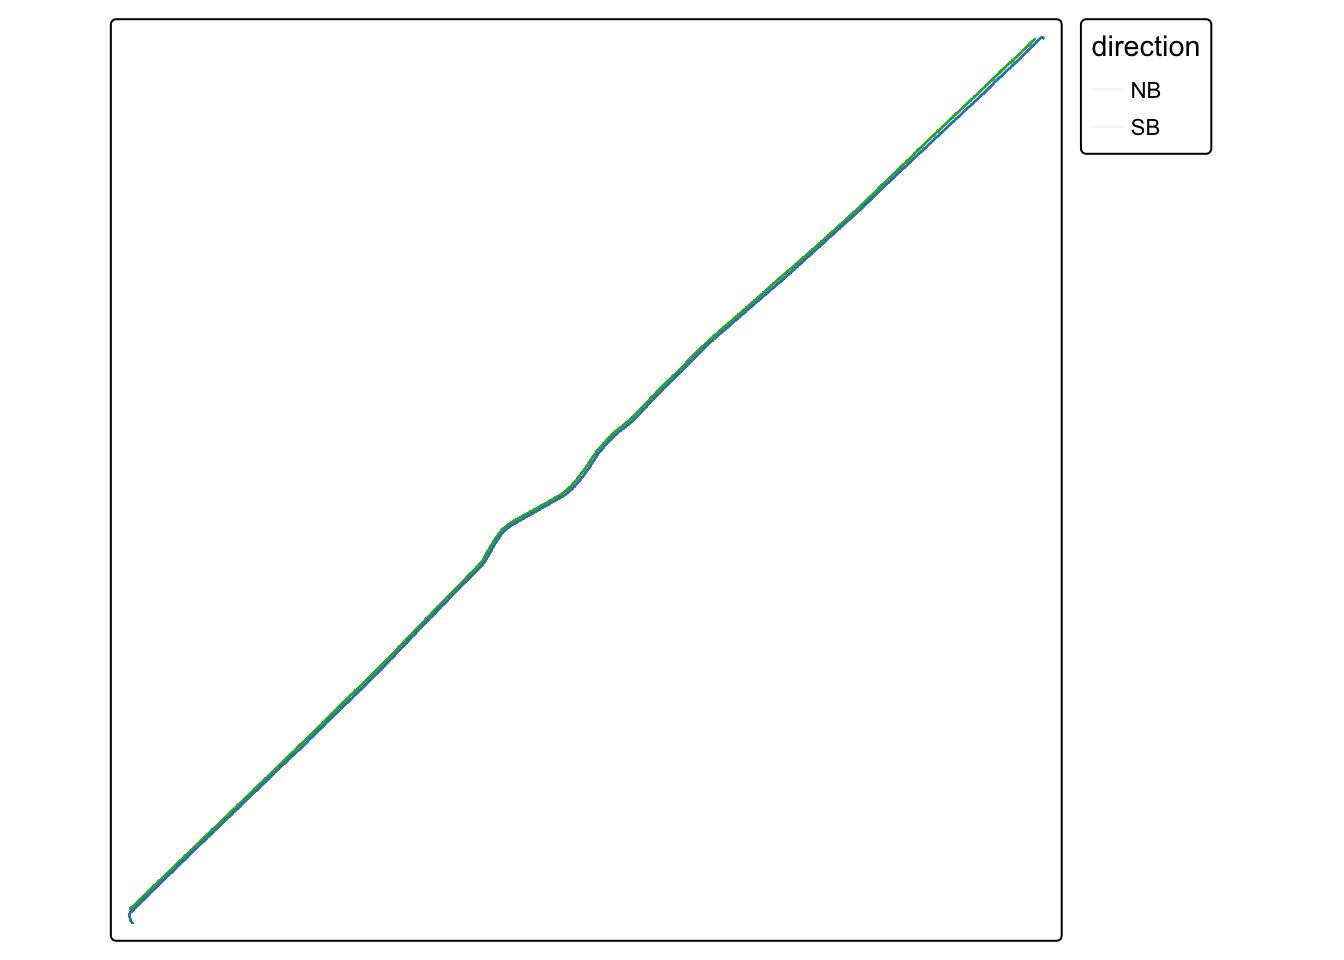
East Washington Avenue
Travel time estimates for the East Washington Ave corridor between Blair and E Springs.
Travel time estimates
Travel time estimates in a sortable and filterable table:
Overall
Summary statistics
| Estimated travel times (minutes) | |||||
| Direction | Mean | Median | Minimum | Maximum | 90% of trips |
|---|---|---|---|---|---|
| NB | 14.4 | 14.3 | 10.7 | 23.4 | 12.2-16.9 |
| SB | 13.7 | 13.6 | 10.4 | 21.8 | 11.8-15.8 |
| Estimated travel times (minutes) | |||||
| Direction | Mean | Median | Minimum | Maximum | 90% of trips |
|---|---|---|---|---|---|
| NB | 14.6 | 14.9 | 11.5 | 16.1 | 12.5-16 |
| SB | 13.6 | 13.7 | 10.6 | 15.3 | 11.6-15.1 |
| Estimated travel times (minutes) | |||||
| Direction | Mean | Median | Minimum | Maximum | 90% of trips |
|---|---|---|---|---|---|
| NB | 14.5 | 14.8 | 11.5 | 16.1 | 12.6-15.7 |
| SB | 13.7 | 13.8 | 10.6 | 16.9 | 11.6-15.4 |
| Estimated travel times (minutes) | |||||
| Direction | Mean | Median | Minimum | Maximum | 90% of trips |
|---|---|---|---|---|---|
| NB | 14.6 | 14.8 | 11.5 | 17.8 | 12.8-15.7 |
| SB | 13.8 | 13.7 | 10.6 | 19.9 | 11.7-15.5 |
Travel time plots
This plot shows the median travel time (middle line), the 25th and 75th percentile (interquartile range; box), 1.5 times the interquartile range (whiskers).
University Avenue
Travel times estimates for University Ave between Bassett and Babcock.
Travel time estimates
Travel time estimates in a sortable and filterable table:
Overall
Summary statistics
| Estimated travel times (minutes) | |||||
| Direction | Mean | Median | Minimum | Maximum | 90% of trips |
|---|---|---|---|---|---|
| WB | 3.3 | 3.2 | 2.2 | 13.6 | 2.6-4.3 |
| Estimated travel times (minutes) | |||||
| Direction | Mean | Median | Minimum | Maximum | 90% of trips |
|---|---|---|---|---|---|
| WB | 3.7 | 3.6 | 2.9 | 4.8 | 3.1-4.6 |
| Estimated travel times (minutes) | |||||
| Direction | Mean | Median | Minimum | Maximum | 90% of trips |
|---|---|---|---|---|---|
| WB | 3.7 | 3.6 | 2.9 | 5.3 | 3.1-4.6 |
| Estimated travel times (minutes) | |||||
| Direction | Mean | Median | Minimum | Maximum | 90% of trips |
|---|---|---|---|---|---|
| WB | 3.7 | 3.6 | 2.8 | 9.1 | 3-4.6 |
Travel time plots
This plot shows the median travel time (middle line), the 25th and 75th percentile (interquartile range; box), 1.5 times the interquartile range (whiskers).
Johnson Street
Travel time estimates for Johnson Street between Babcock/Orchard and First. Note that before October 31, the start point was Orchard St. Since then, the start point is at Babcock.
Travel time estimates
Travel time estimates in a sortable and filterable table:
Overall
Summary statistics
| Estimated travel times (minutes) | |||||
| Direction | Mean | Median | Minimum | Maximum | 90% of trips |
|---|---|---|---|---|---|
| NB | 11.0 | 10.2 | 7.0 | 31.1 | 8.1-16.6 |
| Estimated travel times (minutes) | |||||
| Direction | Mean | Median | Minimum | Maximum | 90% of trips |
|---|---|---|---|---|---|
| NB | 10.0 | 9.9 | 8.1 | 11.3 | 8.7-11.3 |
| Estimated travel times (minutes) | |||||
| Direction | Mean | Median | Minimum | Maximum | 90% of trips |
|---|---|---|---|---|---|
| NB | 10.5 | 10.2 | 8.0 | 15.8 | 8.8-13.5 |
| Estimated travel times (minutes) | |||||
| Direction | Mean | Median | Minimum | Maximum | 90% of trips |
|---|---|---|---|---|---|
| NB | 11.1 | 10.6 | 8.0 | 20.6 | 9-16 |
Travel time plots
This plot shows the median travel time (middle line), the 25th and 75th percentile (interquartile range; box), 1.5 times the interquartile range (whiskers).
Gorham Street
Travel time estimates for Gorham Street between First and Bassett.
Travel time estimates
Travel time estimates in a sortable and filterable table:
Overall
Summary statistics
| Estimated travel times (minutes) | |||||
| Direction | Mean | Median | Minimum | Maximum | 90% of trips |
|---|---|---|---|---|---|
| SB | 7.4 | 6.8 | 4.7 | 22.7 | 5.6-11.1 |
| Estimated travel times (minutes) | |||||
| Direction | Mean | Median | Minimum | Maximum | 90% of trips |
|---|---|---|---|---|---|
| SB | 6.4 | 6.4 | 5.6 | 6.8 | 6-6.8 |
| Estimated travel times (minutes) | |||||
| Direction | Mean | Median | Minimum | Maximum | 90% of trips |
|---|---|---|---|---|---|
| SB | 7.4 | 6.7 | 5.3 | 22.7 | 6-10.7 |
Travel time plots
This plot shows the median travel time (middle line), the 25th and 75th percentile (interquartile range; box), 1.5 times the interquartile range (whiskers).
Broom Street
Travel time estimates for Broom Street between John Nolen and University.
Travel time estimates
Travel time estimates in a sortable and filterable table:
Overall
Summary statistics
| Estimated travel times (minutes) | |||||
| Direction | Mean | Median | Minimum | Maximum | 90% of trips |
|---|---|---|---|---|---|
| NB | 4.2 | 3.5 | 2.0 | 20.9 | 2.5-7.2 |
| Estimated travel times (minutes) | |||||
| Direction | Mean | Median | Minimum | Maximum | 90% of trips |
|---|---|---|---|---|---|
| NB | 6.0 | 6.0 | 4.2 | 7.3 | 5-6.7 |
| Estimated travel times (minutes) | |||||
| Direction | Mean | Median | Minimum | Maximum | 90% of trips |
|---|---|---|---|---|---|
| NB | 6.2 | 6.2 | 4.2 | 8.4 | 5-7.5 |
| Estimated travel times (minutes) | |||||
| Direction | Mean | Median | Minimum | Maximum | 90% of trips |
|---|---|---|---|---|---|
| NB | 6.3 | 6.2 | 2.3 | 20.9 | 3.1-9.2 |
Travel time plots
This plot shows the median travel time (middle line), the 25th and 75th percentile (interquartile range; box), 1.5 times the interquartile range (whiskers).
Regent Street
Travel time estimates for Regent Street between Monroe and
Travel time estimates
Travel time estimates in a sortable and filterable table:
Overall
Summary statistics
| Estimated travel times (minutes) | |||||
| Direction | Mean | Median | Minimum | Maximum | 90% of trips |
|---|---|---|---|---|---|
| EB | 4.5 | 4.2 | 3.3 | 14.5 | 3.7-6 |
| WB | 4.9 | 4.7 | 3.7 | 12.3 | 4.2-6 |
| Estimated travel times (minutes) | |||||
| Direction | Mean | Median | Minimum | Maximum | 90% of trips |
|---|---|---|---|---|---|
| EB | 4.2 | 4.2 | 3.5 | 4.8 | 3.7-4.5 |
| WB | 4.6 | 4.6 | 3.9 | 4.9 | 4.2-4.8 |
| Estimated travel times (minutes) | |||||
| Direction | Mean | Median | Minimum | Maximum | 90% of trips |
|---|---|---|---|---|---|
| EB | 4.2 | 4.2 | 3.5 | 4.9 | 3.8-4.7 |
| WB | 4.6 | 4.6 | 3.9 | 5.1 | 4.4-5 |
| Estimated travel times (minutes) | |||||
| Direction | Mean | Median | Minimum | Maximum | 90% of trips |
|---|---|---|---|---|---|
| EB | 4.4 | 4.2 | 3.5 | 8.7 | 3.8-5.5 |
| WB | 4.8 | 4.6 | 3.9 | 12.3 | 4.4-5.5 |
Travel time plots
This plot shows the median travel time (middle line), the 25th and 75th percentile (interquartile range; box), 1.5 times the interquartile range (whiskers).
Williamson Street
Travel time estimates for Williamson Street between the “Hairball” and Thornton.
Travel time estimates
Travel time estimates in a sortable and filterable table:
Overall
Summary statistics
| Estimated travel times (minutes) | |||||
| Direction | Mean | Median | Minimum | Maximum | 90% of trips |
|---|---|---|---|---|---|
| NB | 3.7 | 3.7 | 2.6 | 6.7 | 3.3-4.4 |
| SB | 3.3 | 3.2 | 2.5 | 8.0 | 2.8-4 |
| Estimated travel times (minutes) | |||||
| Direction | Mean | Median | Minimum | Maximum | 90% of trips |
|---|---|---|---|---|---|
| NB | 3.5 | 3.5 | 3.3 | 3.9 | 3.3-3.8 |
| SB | 3.3 | 3.2 | 2.9 | 4.1 | 2.9-3.9 |
| Estimated travel times (minutes) | |||||
| Direction | Mean | Median | Minimum | Maximum | 90% of trips |
|---|---|---|---|---|---|
| NB | 3.5 | 3.5 | 2.8 | 4.2 | 3.3-3.8 |
| SB | 3.2 | 3.2 | 2.7 | 4.1 | 2.9-3.8 |
| Estimated travel times (minutes) | |||||
| Direction | Mean | Median | Minimum | Maximum | 90% of trips |
|---|---|---|---|---|---|
| NB | 3.6 | 3.6 | 2.8 | 4.3 | 3.4-4 |
| SB | 3.2 | 3.2 | 2.6 | 4.5 | 2.8-3.8 |
Travel time plots
This plot shows the median travel time (middle line), the 25th and 75th percentile (interquartile range; box), 1.5 times the interquartile range (whiskers).